
PUBLICATIONS
All contents and Orders moved to new Hompage (www.nanoglia.com)
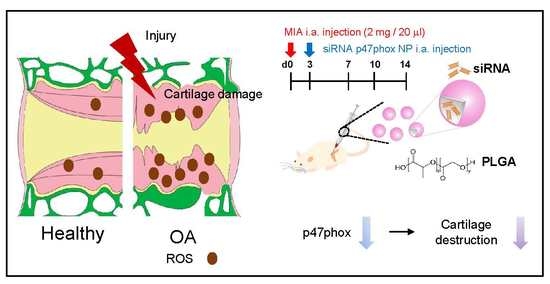
1. Shin HJ, Park H, Shin N, Kwon HH, Yin Y, Hwang JA, Kim SI, Kim SR, Kim S, Joo Y, Kim Y, Kim J, Beom J, Kim DW*.
p47phox siRNA-Loaded PLGA Nanoparticles Suppress ROS/Oxidative Stress-Induced Chondrocyte Damage in Osteoarthritis.
Polymers (Basel). 2020 Feb 13;12(2). pii: E443.
doi: 10.3390/polym12020443. PubMed PMID: 32069893.
https://www.mdpi.com/2073-4360/12/2/443
3: Shin HJ, Park H, Shin N, Shin J, Gwon DH, Kwon HH, Yin Y, Hwang JA, Hong J, Heo JY, Kim CS, Joo Y, Kim Y, Kim J, Beom J, Kim DW*.
p66shc siRNA Nanoparticles Ameliorate Chondrocytic Mitochondrial Dysfunction in Osteoarthritis.
Int J Nanomedicine. 2020 Apr 8;15:2379-2390.
doi: 10.2147/IJN.S234198. eCollection 2020. PubMed PMID: 32308389; PubMed Central PMCID: PMC7152540.

4: Phạm TL, Yin Y, Kwon HH, Shin N, Kim SI, Park H, Shin J, Shin HJ, Hwang JA, Song HJ, Kim SR, Lee JH, Hwang PTJ, Jun HW, Kim DW*.
miRNA 146a-5p-loaded poly(d,l-lactic-co-glycolic acid) nanoparticles impair pain behaviors by inhibiting multiple inflammatory pathways in microglia.
Nanomedicine (Lond). 2020 Apr 15.
doi: 10.2217/nnm-2019-0462. [Epub ahead of print] PubMed PMID: 32292108.

5. Shin N, Shin HJ, Yi Y, Beom J, Lee W, Lee CH, Kim DW*
p66shc siRNA-Encapsulated PLGA Nanoparticles Ameliorate Neuropathic Pain Following Spinal Nerve Ligation
Polymers 2020, 12(5), 1014;
6. CX3CR1-Targeted PLGA Nanoparticles Reduce Microglia Activation and Pain Behavior in Rats with Spinal Nerve Ligation.
Noh C, Shin HJ, Lee S, Kim SI, Kim YH, Lee WH, Kim DW, Lee SY, Ko YK.
Int J Mol Sci. 2020 May 14;21(10):E3469.
doi: 10.3390/ijms21103469.PMID: 32423102
7. Phạm TL, Kim DW*.
Poly(lactic-co-glycolic acid) nanomaterial-based treatment options for pain management: a review.
Nanomedicine (Lond). 2020 Aug 6.
doi: 10.2217/nnm-2020-0114. Epub ahead of print. PMID: 32757701.
7. Phạm TL, Kim DW*.
Poly(lactic-co-glycolic acid) nanomaterial-based treatment options for pain management: a review.
Nanomedicine (Lond). 2020 Aug 6.
doi: 10.2217/nnm-2020-0114. Epub ahead of print. PMID: 32757701.
2019 year
1. Shin J, Yin Y, Kim DK, Lee SY, Lee W, Kang JW, Kim DW*, Hong J.
Foxp3 plasmid-encapsulated PLGA nanoparticles attenuate pain behavior in rats with spinal nerve ligation.
Nanomedicine. 2019 Mar 8. pii: S1549-9634(19)30054-1.
doi: 10.1016/j.nano.2019.02.023. [Epub ahead of print] PubMed PMID: 30858084.
https://doi.org/10.1016/j.nano.2019.02.023
 |
| Figure 1. Experimental scheme of this study. Neuropathic pain was induced in rats with lumbar 5 (L5) spinal nerve ligation (SNL). Negative control or Foxp3 plasmid (pFoxp3)-encapsulated poly (D, L-lactic-co-glycolic acid) (PLGA) nanoparticles (NC NPs and Foxp3 NPs, respectively) were then delivered intrathecally into the spinal subarachnoid space of test animals using a Hamilton syringe with a 26.5 G needle. Afterwards, the animals were subjected to behavioral tests using von Frey filaments to evaluate the analgesic effect of Foxp3 NPs on SNL-induced neuropathic pain. |
 |
Figure
2. Foxp3 expression in rats with SNL-induced neuropathic pain. (A) On days 3 and 7 post-SNL operation, total
RNA was isolated from L4–L5 segments of the spinal cord ipsilateral dorsal horn
and utilized for cDNA synthesis. The mRNA level of Foxp3 was analyzed by quantitative
real-time PCR (qPCR). A sham group was used as the control.
Data are presented as mean ± standard error of the mean (SEM) (one-way
analysis of variance [ANOVA] with Turkey’s post-hoc test; ***P < 0.001 and *P < 0.01 vs. Sham; n = 4–6 per group). POD = post-operative day.
(B) On days 3 and 7 post-SNL
surgery, L5 spinal sections were prepared and incubated with anti-Foxp3
antibodies. Arrowheads indicate Foxp3-positive cells. Scale bar = 50 μm (left),
10 μm (right).
|
 |
Figure
3. Foxp3 overexpression suppresses the mRNA expression of proinflammatory genes
in LPS-stimulated BV2 cells. (A) The pFoxp3 was constructed
by subcloning of the coding sequence (1,287 base pairs) of mouse Foxp3 into the
negative control plasmid (pNC; left). The constructs were confirmed by the mCherry
expression under a fluorescent microscope (middle), and the Foxp3 expression (right)
by immunoblot analysis in HEK293T cells transfected with pNC or pFoxp3. β-actin
was used as the loading control (right). Data are expressed as
mean ± SEM (unpaired Student’s t-test;
***P < 0.001 vs. pNC-transfected
cells). (B) pNC or pFoxp3 were
transfected into BV2 cells for 2 days. Then, the mRNA levels of tumor necrosis factor-alpha (TNF-α), interleukin (IL)-1β,
and IL-6 in the absence or presence of lipopolysaccharide
(LPS) (100 ng/ml) were assessed for 3 hours by qPCR. Data are expressed
as mean ± SEM (one-way ANOVA with Turkey’s post-hoc test; ***P < 0.001 and **P < 0.05 vs. pNC + LPS).
|
 |
Figure
4. Physical characterization and cytotoxicity of the plasmid-encapsulated PLGA NPs.
(A) Plasmid-encapsulated PLGA NPs were prepared by briefly
sonicating the mixture of PLGA and plasmid, and then examined for particle size
and zeta potential using a Zetasizer Nano ZS and scanning electron microscopy. Scale
bar = 500 nm. (B) BV2 cells were
incubated with NPs (0–200 μg/mL) for 24 h. Their cytotoxicity was then investigated
by 3-(4,5-dimethylthiazol-2-yl)-2,5-diphenyltetrazolium bromide (MTT) assay.
Data are expressed as mean ± SEM (one-way ANOVA test; n.s., not
significant).
|
 |
Figure
5. Foxp3 NPs efficiently inhibit the transcription of proinflammatory mediators
in LPS-stimulated BV2 cells. (A) HEK293T cells were
treated with NC NPs or Foxp3 NPs for 2 days. The expression levels were then determined
by mCherry under a fluorescent microscope (left) and Foxp3 on western blot (right).
(B) NC NPs or Foxp3 NPs (100 μg/mL) were
added to BV2 cells for 2 days. Later, the mRNA expression levels of
proinflammatory mediators, such as TNF-α, IL-1𝛽 and IL-6, after 3-h LPS treatment (100 ng/ml), were measured by qPCR.
Data are expressed as mean ± SEM (one-way ANOVA with Turkey’s
post-hoc test; **P < 0.01 and *P < 0.05 vs. NC NPs + LPS).
|
 |
Figure
6. Foxp3 NPs mainly localize in the spinal microglia of
SNL-induced rats. (A) Foxp3
NPs were intrathecally administered to SNL-induced rats. On day 4 post-injection,
L5 fragments of the spinal cord were isolated, sectioned and used for
immunostaining with anti-Foxp3 antibodies to examine the expression of Foxp3 in
Foxp3 NPs-localized cells. Arrowheads indicate mCherry+/Foxp3+-
positive cells. Scale bar = 20 μm (left), 10 μm (right). (B) The same spinal tissues described above were also immunostained
with anti-Iba1 (microglial marker), GFAP (astrocytic marker) and NeuN (neuronal
marker) antibodies. Arrowheads indicate mCherry+/Iba1+-,
mCherry+/GFAP+- and mCherry+/Neuron+-positive
cells. Scale bar = 20 μm. Data are expressed as
mean ± SEM (one-way ANOVA with Turkey’s post-hoc test; ***P < 0.001 vs. mCherry+/Iba1+- positive cells).
|
 |
Figure
7. Foxp3 NPs notably attenuate the mechanical hypersensitivity of rats with SNL
by reducing spinal microglia activation. (A) After environmental adaptation for 1 week, rats
insensitive to the von Frey filaments test (> 10 g filament) were used for
SNL surgery. On day 3 post-surgery, sensitive rats (< 4 g filament) were
randomly divided into two groups (NC NPs and Foxp3 NPs) and intrathecally
injected with two NPs. Later,
several tests for pain behavior and gene expression were conducted at the indicated-time
points. (B) After NPs injection, von
Frey filaments tests were performed daily from day 5 to 10 post-surgery. Data are
presented as mean ± SEM (two-way ANOVA with Bonferroni’s post-hoc
test; ***P < 0.001 vs. NC NPs on
day 7; n = 5–6). (C) L5 spinal
sections from the sham group, POD3, and POD7, were prepared and used for
immunostaining with anti-Iba1 antibodies. Dotted lines indicate the ipsilateral
side of the spinal dorsal horn. Scale bar = 50 μm. Data are presented as
mean ± SEM (two-way ANOVA with Bonferroni’s post-hoc test; ***P < 0.001 vs. NC NPs on day 7; n = 3–4).
POD, post-operative day.
|
 |
Figure 8. Foxp3 NPs modulate the expression of neuropathic
pain-related genes in the spinal dorsal horn of SNL-induced rats. (A) On day 4 post-injection of NPs, total RNA was
isolated from the L4–L5 segment (0.7 cm) of the ipsilateral spinal dorsal horn
and used for cDNA synthesis. Later, mRNA levels of TNF-α, IL-1β, IL-6 and cyclooxygenase
(COX)-2 were determined by qPCR. Data are presented as mean ± SEM
(one-way ANOVA with Turkey’s post-hoc test; ***P < 0.001 and **P <
0.01 vs. NC NPs on day 7; n = 3–5 per group). (B) The same sections used in Figure 6C were double-immunostained
with anti-Iba1 and anti- inducible nitric oxide synthase (iNOS) and anti-arginase
1 (Arg1) antibodies. Arrowheads indicate iNOS+/Iba1+- or
Arg1+/Iba1+- positive cells. Scale bar = 50 μm (left), 10
μm (right). Data are presented as mean ± SEM (one-way ANOVA with Turkey’s
post-hoc test; ***P < 0.001, **P < 0.01, and *P < 0.05 vs. NC NPs; n = 6–8 per group).
|
2. Shin J, Yin Y, Park H, Park S, Triantafillu UL, Kim Y, Kim SR, Lee SY, Kim DK, Hong J, Kim DW*.
p38 siRNA-encapsulated PLGA nanoparticles alleviate neuropathic pain behavior in rats by inhibiting microglia activation.
Nanomedicine (Lond). 2018 Jul;13(13):1607-1621.
doi: 10.2217/nnm-2018-0054. PubMed PMID: 30028250.
https://goo.gl/rnqfH6
p38 siRNA-encapsulated PLGA nanoparticles alleviate neuropathic pain behavior in rats by inhibiting microglia activation.
Nanomedicine (Lond). 2018 Jul;13(13):1607-1621.
doi: 10.2217/nnm-2018-0054. PubMed PMID: 30028250.
https://goo.gl/rnqfH6
 |
Figure 1. Experimental scheme
of this study. Neuropathic
pain in rats was induced by L5 spinal nerve ligation. Scrambled siRNA- or p38
siRNA-encapsulated PLGA nanoparticles were then delivered intrathecally into
the subarachnoid space using a Hamilton syringe. Rats were then subjected to behavioral
tests using von Frey filaments to evaluate the effect of p38siRNA PLGA
nanoparticles on neuropathic pain.
|
 |
Figure 2. p38 siRNA inhibits p38
expression in BV2 cells and reduces expression of proinflammatory mediators in
LPS-stimulated BV2 cells
(A) p38 siRNA (10,
20, and 50 nM) or scrambled siRNA (sc siRNA, 20 nM) were transfected into BV2
cells with RNAiMAX reagents. After 2 d, p38 mRNA levels were assessed by
quantitative real-time PCR (qPCR). (B)
sc siRNA (10 nM) or p38 siRNA (10 nM) were transfected into BV2 cells for 2 d.
The expression of p38 or p-p38 protein was then detected with anti-p38 or
anti-p-38 antibodies by western blotting and quantified by p38/ACTB or p-p38/ACTB
ratio. (C) p38 siRNA (10 nM) or sc
siRNA (10 nM) were transfected into BV2 cells for 2 d. mRNA expression of TNF-α,
iNOS, Nrf2, and COX-2 were quantified by qPCR. Data are expressed as the mean ± SEM
(one-way ANOVA test, ***P < 0.001
vs sc siRNA + LPS).
|
 |
Figure 3. Characterization of
siRNA-encapsulated PLGA nanoparticles
(A–B)
siRNA-encapsulated PLGA nanoparticles were dissolved in water and measured for size
and zeta-potential using a Zetasizer. (C)
Suspended nanoparticles were also assessed by TEM and SEM. Scale bar = 200 nm
|
 |
Figure 4. Cytotoxicity and
cellular uptake of PLGA nanoparticles
(A) BV2 cells were incubated
with p38 siRNA-loaded PLGA nanoparticles (0–200 μg/mL) for 24 h and examined for
cytotoxicity by MTT assay. Data are expressed as the mean ± SEM (one-way
ANOVA test, n.s., not significant). (B) Coumarin
6-loaded PLGA nanoparticles were incubated for 3 h at 50 μg/mL in BV2
(microglia), HT22 (neurons), and U87MG (astrocytes) cells and examined under a fluorescent
microscope to assess cellular uptake. (C)
Two days after intrathecal injection of Coumarin 6 PLGA nanoparticles (C6
NPs, 200 μg in 20 μL), the L4-6 section of the spinal cord was excised and used
for immunostaining with anti-NeuN (a neuronal marker), anti-GFAP (an astrocytic
marker), or anti-OX42 (a microglial marker) antibodies to visualize the
distribution of C6 NPs in the spinal cord. Scale bar = 50 μm (left), 20 μm
(right). The number of C6 NPs-incorporated astrocytes, neurons and microglia
was counted. Data are expressed as the mean ± SEM (one-way ANOVA
test, ***P < 0.001 vs OX42).
|
 |
Figure 5. Intrathecal
injection of p38 siRNA-encapsulated PLGA nanoparticles attenuates mechanical
hypersensitivity in SNL-induced rats
(A) Prior to SNL surgery, rats were subjected to a von Frey
filament test with only those passing a pre-defined baseline (>10-g) selected
for L5 SNL surgery.
Following surgery, the von Frey test was repeated on days 3, 7, 10, and 14
post-injury. Data are presented as the mean ± SEM (Student t- test, ***P < 0.001 vs sham) (B)
Spinal cord tissues (L5, POD7) were immunostained with anti-Iba1 antibodies (a
microglia-specific marker). Magnified images represent sections taken from sites
contralateral or ipsilateral to the dorsal horn of the spinal cord. Scale bar =
150 μm (upper), 100 μm (bottom) (C) Animals
insensitive to the von Frey test (>10-g filament) were selected for SNL surgery.
At day 7 post-SNL, sensitive rats (< 4-g filament) were divided into three
groups (sc siRNA NPs, SB203580, and p38 siRNA NPs), with compound delivered directly
to the lumber (L5–L6) intervertebral space by intrathecal injection. von Frey
filament tests were performed on days 10, 12, and 14 post-surgery. Data are presented
as the mean ± SEM (one-way ANOVA test; ***P < 0.001 vs sc siRNA NPs, ###P < 0.001 vs SB203580; n.s. (not significant), p38 siRNA NPs vs. SB203580).
|
 |
Figure 6. p38
siRNA-encapsulated PLGA nanoparticles deactivate microglia and downregulate expression
of genes downstream of p38 in the dorsal horns of the spinal cords in
SNL-induced rats
sc
siRNA- or p38 siRNA-loaded PLGA nanoparticles (NPs) were transferred into the
lumber (L5–L6) intervertebral space of SNL-induced rats by intrathecal
injection. (A) After 3 days, the L4–L5
section of the spinal cord was removed and used for immunostaining with
anti-Iba1 antibodies. Magnified images (right) were taken from the ipsilateral
dorsal horn of the spinal cord. Scale bar = 50 μm (left), 20 μm (right). (B) Total mRNA was isolated from the L4–L5
segment (0.7 cm) of the ipsilateral dorsal horn of the spinal cord at day 3
post-injection and utilized for cDNA synthesis. Expression of TNF-α, IL-1β,
COX-2, and iNOS mRNA was then measured by qPCR. Data are presented as the mean ± SEM
(one-way ANOVA test, *P < 0.5 vs
sc siRNA NPs).
|
 |
Figure 7. p38 siRNA-encapsulated
PLGA nanoparticles decrease phosphorylation of p38 in microglia of the ipsilateral
dorsal horn of the spinal cord in SNL-induced rats
(A) Frozen sections
of spinal cords isolated from SNL-induced rats (POD7) were double-stained with
anti-p-p38 and anti-OX-42 antibodies, anti-p-p38 and anti-NeuN antibodies, or
anti-p-p38 and anti-GFAP antibodies. Scale bar = 50 μm (left), 20 μm (right). (B) The tissues used in Figure 6A were
also co-immunostained with anti-p-p38 and anti-OX42 antibodies to identify the
double-positive signals in microglia. Scale bar = 50 μm (left), 20 μm (right). The
number of p-p38 or p-p38/OX42 positive cells in
ipsilateral dorsal horns of spinal cords was counted. Data are
expressed as the mean ± SEM (Student t- test, ***P < 0.001
vs sc NPs).
|

